
For most U.S. eBay sellers, the right answer is two-tier: start with eBay Seller Hub for daily reporting, then upgrade to SpareDollar when you need cross-channel inventory sync, per-unit profit visibility, and AI-assisted listing workflows. Seller Hub covers your sales trends, listing impressions, and Terapeak access well enough for a single-channel store. The moment you’re selling on more than one marketplace, or you want to know your actual margin after fees and shipping, it runs out of road fast.
Here’s what to do right now:
- Use Seller Hub as your free baseline for daily sales and traffic data.
- Export an orders CSV from Seller Hub (Orders tab → Export) and map your cost of goods for your most important SKUs.
- Run the 60-day test plan in the “How to use analytics” section below to measure real impact before committing to any paid tool.
- When you hit cross-channel blind spots or profit visibility gaps, SpareDollar fills both with one connected workflow.
Pro Tip: Export your orders CSV on the same day each week. Consistent export timing makes week-over-week comparisons clean and keeps your baseline honest.
Key Takeaways
An eBay analytics dashboard is only as useful as the action it drives. Start with clean exports, add cost data, and let the metrics tell you where to work first.
| Point | Details |
|---|---|
| Start with Seller Hub exports | Export 60 days of orders and listing performance as your baseline before adding any third-party tool. |
| Track margin, not just revenue | Add COGS to your orders CSV to calculate net profit per SKU; revenue without margin data misleads sourcing decisions. |
| Fix CTR before price | Listings with CTR below 1.5% need a title or image fix first; price changes on low-CTR listings rarely move the needle. |
| Set inventory buffers early | A 1–2 unit buffer per channel prevents oversells during syncs and protects your seller metrics. |
| SpareDollar closes the loop | SpareDollar connects profit analytics to AI-assisted listing creation and cross-channel sync in one workflow. |
Table of Contents
- What does eBay’s built-in analytics dashboard actually show?
- Why Seller Hub’s reports may not be enough to grow your store
- What third-party eBay analytics dashboards add
- Core metrics every eBay analytics dashboard should track
- How to run a 60-day analytics test on your eBay store
- How to choose the right eBay analytics dashboard for your store
- How SpareDollar fills the gaps eBay’s native tools leave open
- Quick-start checklist you can finish today
- What actually works in live stores
- SpareDollar turns your analytics into live listings, not just reports
- Sources
- FAQ
What does eBay’s built-in analytics dashboard actually show?
eBay Seller Hub is the native eBay analytics dashboard, and it covers more ground than most sellers realize. The problem isn’t that it’s empty. It’s that the data lives in separate tabs and requires manual assembly to mean anything.
Here’s what each core report gives you and where to find it:
- Sales report (Performance → Sales): revenue by date range, units sold, and average sale price. Export as CSV for trend analysis.
- Orders export (Orders → Export): transaction-level data including item ID, title, quantity, sold price, final value fees, shipping collected, and buyer location. This is your most valuable raw export.
- Listing performance (Research → Listing Analytics): impressions, CTR, and page views per listing. Export or screenshot by date range.
- Traffic sources (Performance → Traffic): shows how buyers found your listings (organic search, promoted, external). No CSV export available; screenshot or manual note.
- Seller performance (Performance → Seller Dashboard): defect rate, late shipment rate, and return rate. Useful for spotting fulfillment problems before they hit your standing.
- Terapeak Product Research (Research → Terapeak): completed-sales price history, sell-through rates by category, and top-selling items. Accessible free inside Seller Hub.
The item-level performance tutorial walks through exporting the orders CSV and uploading it to an analytics tool to surface top performers, revenue by SKU, and margin when you add cost data.
Key fields to keep when you export your orders CSV:
| Field | Why it matters |
|---|---|
| Item ID | Links orders to listing data |
| Item title | Identifies SKU without a separate lookup |
| Quantity sold | Units per transaction |
| Sold price | Gross revenue per line |
| Final value fee | eBay’s cut per transaction |
| Shipping collected | Revenue from buyer shipping |
| Shipping cost | Your actual outbound cost |
| Transaction date | Time-series analysis |
| Buyer location | Demand geography |
Why Seller Hub’s reports may not be enough to grow your store
Seller Hub gives you the raw ingredients. It doesn’t cook the meal. Here’s where sellers hit the wall:
Cross-channel blind spots. Seller Hub sees only eBay. If you’re also selling on Poshmark, Mercari, or Shopify, you have no unified inventory view. That gap causes oversells during promos and makes repricing decisions unreliable because you’re working from partial stock counts. eBay’s native tools don’t provide cross-channel sync, and the fix requires either a third-party tool or a lot of manual reconciliation.
Profit blindness. Seller Hub shows gross revenue. It does not calculate per-unit net margin across fees, shipping costs, and cost of goods. You can have a busy month and still lose money on your top-selling SKU without knowing it.
Limited price history and trend signals. Terapeak shows completed-sales data, but its historical window and category depth are narrower than dedicated market-insight tools. Predictive trend signals, price velocity, and top-seller tracking by niche aren’t available natively.
Export and automation limits. Every analysis cycle means another manual CSV pull. There are no automated action queues, no repricer triggers, and no relist rules. eBay’s standard API rate limits also constrain full-catalog syncs for larger stores, which means delta-based sync (updating only changed records) becomes necessary at scale.
Pro Tip: To bridge the profit gap immediately, add three columns to your orders CSV: COGS, shipping cost, and net margin (sold price minus final value fee, shipping cost, and COGS). Even a basic spreadsheet formula gives you per-unit profit visibility today, before you connect any dashboard.
What third-party eBay analytics dashboards add
Third-party dashboards don’t replace Seller Hub. They sit on top of it and fill the gaps that matter for growth.
The core capability categories worth evaluating:
- Market price trends and completed-sales history. Tools like ZIK Analytics surface price trends, top-selling products, and seller-level trend signals updated daily. For used or refurbished sellers, this is how you set a defensible price floor without guessing.
- Cross-channel inventory and order sync. A unified dashboard pulls orders and stock counts from eBay, Amazon, Shopify, Poshmark, and others into one view. This is the single biggest operational upgrade for multi-channel sellers.
- Profit and margin reporting. When you input COGS, a third-party dashboard calculates gross and net margin per SKU after fees and shipping. Putler, for example, aggregates sales data across channels and adds profit-layer reporting.
- Segmentation and cohort analysis. Custom-label segmentation groups orders by seller-defined labels and calculates revenue share, average order value, and profitability per segment. This reveals which SKU groups are actually driving margin versus just volume.
- Automated action queues. Reprice rules, relist triggers, and auto-delist on sale reduce the manual work that kills scaling. SpareDollar handles auto-delist on sale and per-channel pricing natively.
- Product research tools. AlgoPix provides product-level market data across multiple marketplaces, useful for sourcing decisions and competitive pricing. Terapeak (inside Seller Hub) covers eBay-specific completed sales.
When each capability matters most: price-history tools matter most for used/refurbished sellers setting margins; segmentation matters for bundle sellers and wholesalers; cross-channel sync is non-negotiable for anyone selling on three or more platforms.
Core metrics every eBay analytics dashboard should track
Not every metric deserves weekly attention. These are the ones that actually move decisions, along with the action each one triggers.
| Metric | Benchmark / action trigger |
|---|---|
| Impressions | Low impressions → SEO or category issue; fix title and item specifics |
| CTR | Below 1.5% → test new main image or title |
| Conversion rate | Below category average → price audit or listing quality review |
| Sell-through rate | Below 30% in 30 days → reprice or delist |
| Average sale price | Declining trend → check competitor pricing with Terapeak or ZIK |
| Days to sell | Rising → inventory buildup risk; reduce reorder quantity |
| Gross margin per unit | Negative or thin → COGS or fee structure problem |
| Final value fee % | Above 1.5% → review category or pricing tier |
| Promoted listing RoAS | Below 3x → reduce ad rate or pause underperformers |
| Return rate | Above 2% → listing accuracy or product quality issue |
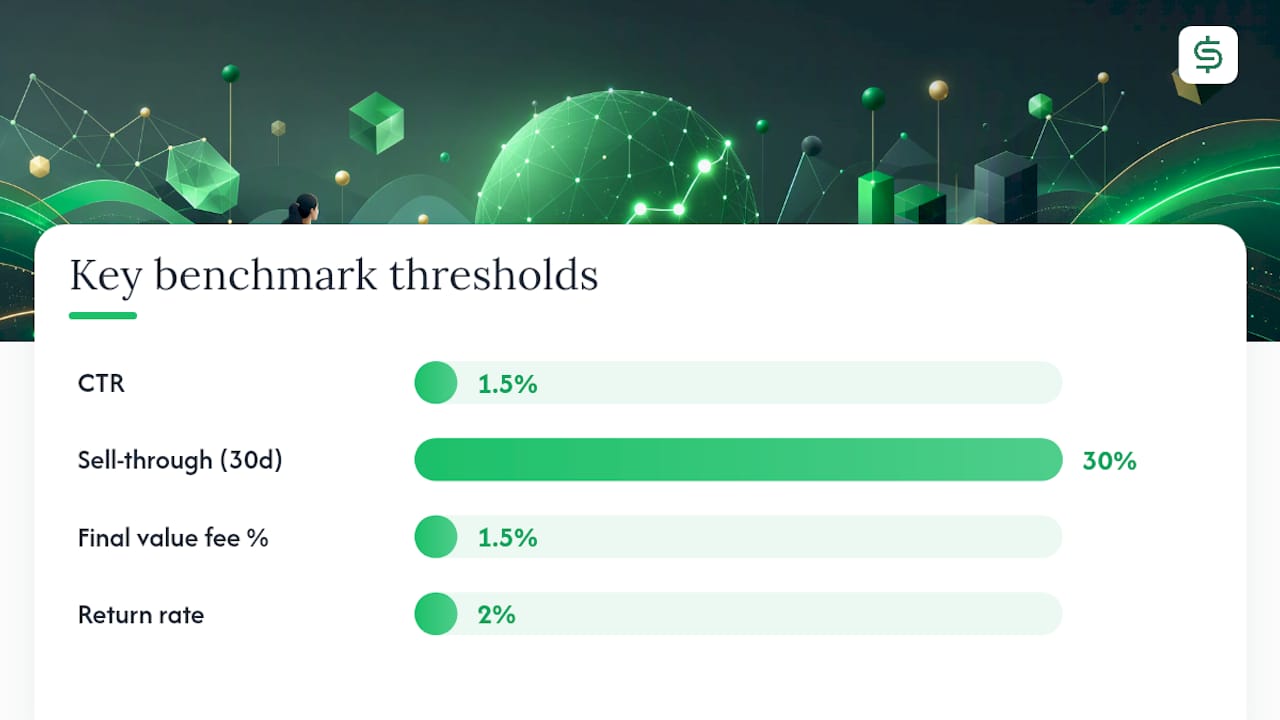
eBay SEO benchmarks set impressions and CTR thresholds as the primary iteration triggers. The practical workflow is: metric falls below threshold → listing enters action queue → fix title, image, or price → measure lift over 14 days.
For repricing decisions, pairing sell-through rate with average sale price helps guide whether to lower price to move volume or hold price to protect margin.
For eBay pricing tools that automate this loop, the key is finding one that reads directly from your dashboard data rather than requiring a separate manual input.
How to run a 60-day analytics test on your eBay store
This is a time-bound playbook. Run it once and you’ll know exactly which dashboard fits your store.
Days 0–7: Baseline
- Export 60 days of orders from Seller Hub (CSV, all fields).
- Export listing performance for your key listings to track impressions, CTR, and page views.
- Export your fees summary for the same period.
- Add COGS to your orders CSV for your top 20 SKUs.
- Connect your analytics dashboard and import the CSV. Follow the item-level analysis tutorial to map columns correctly.
- Enable eBay’s out-of-stock option and set a 1–2 unit buffer on your top-velocity SKUs to prevent oversells during the test period.
Weeks 2–4: Identify and act
- Pull your top 20% of listings by revenue and margin. These are your winners.
- Pull your bottom 20% by sell-through rate. These are your candidates for repricing or delisting.
- Build an action queue: price test on 5 underperformers, title A/B on 3 low-CTR listings, image refresh on 2 high-impression/low-CTR listings.
- Launch a promoted listing on your top 5 margin SKUs at a conservative ad rate. Promoted Listings Standard is among the highest-ROI ad formats on eBay for many sellers.
Weeks 5–8: Measure and iterate
- Run segmented reports using custom labels to compare performance before and after changes.
- Check CTR lift on the listings you edited. A move from 1.2% to 2.0% CTR on a high-impression listing is a meaningful signal.
- Adjust repricer rules based on sell-through data. Raise prices on listings selling faster than expected; lower on stagnant inventory.
- Schedule an automated weekly sync so your data stays current without manual pulls.
- At day 60, compare net margin per unit and sell-through rate against your baseline. Those two numbers tell you whether the dashboard earned its subscription.
Pro Tip: For multi-channel SKUs, set a 1–2 unit inventory buffer per channel before you start the test. Without it, a simultaneous sale on two platforms will oversell you before your sync catches up, which skews your test results and annoys buyers.
A CTR below 1.5% on a listing with strong impressions is almost always a title or image problem, not a pricing problem. Fix the creative before you touch the price.
How to choose the right eBay analytics dashboard for your store
The right dashboard depends on your catalog size, channel count, and how much of the work you want automated.
Decision checklist:
- Does it connect to eBay’s API directly, or does it rely on CSV uploads?
- Does it support cross-channel sync (Shopify, Amazon, Poshmark, Mercari)?
- Can you input COGS for profit reporting?
- Does it offer automated actions (repricer, auto-delist, relist)?
- How does it handle eBay’s API rate limits for large catalogs?
- Is pricing per-listing, per-channel, or a flat subscription?
- Is there a free trial with full feature access?
Sizing guidance:
- Hobby sellers (under 200 listings): Seller Hub plus Terapeak covers most needs. A third-party tool adds value mainly for price-history research and profit tracking.
- Scaling sellers (200–2,000 listings): Cross-channel sync, profit reporting, and automated action queues become worth paying for. This is where the manual CSV cycle starts costing real time.
- Enterprise sellers (over 2,000 listings): API rate-limit handling, bulk actions, and segmentation become critical. Delta-based sync (updating only changed records) is necessary to stay within eBay’s call limits.
Trial evaluation steps:
- Connect 20–30 sample SKUs during the trial period.
- Run a 7-day sync and check for oversells or data gaps.
- Input COGS for 10 SKUs and verify the margin calculation matches your spreadsheet.
- Check user reviews on G2 for integration reliability and support response time. Those two factors matter more than feature lists during a short trial.
For multi-channel inventory management, the key question is whether the tool updates stock counts in near-real-time or on a delay. A 15-minute sync lag is fine for low-velocity SKUs. For fast-moving items during a sale, it can mean an oversell.
How SpareDollar fills the gaps eBay’s native tools leave open
SpareDollar was built specifically for eBay sellers who’ve outgrown Seller Hub’s reporting but don’t want to stitch together five separate tools to get there.
What it covers:
- Create one listing draft and push it to multiple marketplaces (eBay, Poshmark, Depop, Mercari, Shopify) with per-channel pricing.
- AI-assisted listing drafts that auto-populate item specifics. You review and approve before anything goes live.
- Cross-channel inventory sync with auto-delist on sale, so a sold item on Poshmark pulls the eBay listing automatically.
- Barcode scanning for fast COGS input and product identification.
- Profit analytics that calculate gross and net margin per SKU after fees, shipping, and COGS.
- Bulk actions for repricing, relisting, and delisting across your catalog.
- Free imports from eBay, Poshmark, Depop, Mercari, and Shopify.
Three U.S. seller use cases where it fits well:
- Small reseller launching 50 SKUs: Use the barcode scanner to log COGS at intake, draft listings with AI, and push to eBay and Poshmark simultaneously. The whole intake-to-live workflow takes a fraction of the time it would manually. (Think of it as having a very fast intern who never asks for a lunch break.)
- Multi-channel retailer during a promo: Auto-delist on sale prevents the oversell that ruins your seller metrics. Per-channel pricing lets you run a discount on Mercari without touching your eBay price.
- Refurbished-electronics seller: Combine SpareDollar’s profit analytics with Terapeak price history to set a margin floor before listing. You know your cost, you know the market price, and you know your net after fees before the listing goes live.
Trial flow:
- Create your SpareDollar account.
- Connect your eBay account via OAuth (no stored credentials).
- Import your existing eBay listings.
- Map COGS for your top SKUs.
- Review the Top Winners dashboard after 7 days of sync.
Explore SpareDollar’s eBay integration to see the full feature set before you start.
Quick-start checklist you can finish today
No dashboard does anything useful until you feed it clean data. These steps take under two hours.
- Export 60 days of orders from Seller Hub (Orders → Export, all fields, CSV).
- Export listing performance for your top 50 listings.
- Assemble COGS for your top 20 SKUs (purchase price plus inbound shipping).
- Enable eBay’s out-of-stock option in account settings.
- Set a 1–2 unit inventory buffer on your top-velocity SKUs.
- Flag every listing with CTR below 1.5% for a title or image fix.
- Run a promoted listing on your top 5 margin SKUs at a low ad rate.
- Schedule a weekly sync or export so your data doesn’t go stale.
Three quick wins for today:
- Fix your lowest-CTR listings first. A title or main image change on a high-impression listing is the fastest path to more clicks without spending on ads.
- Launch promoted listings on your top-margin SKUs at a conservative rate. This is a low-risk test with measurable results in 7 days.
- Set your inventory buffers before you connect any sync tool. Good order management practices start with accurate stock counts, not with software.
Pro Tip: For COGS mapping, use your supplier invoice or purchase receipt as the source of truth. Estimated COGS creates estimated margins, which leads to real pricing mistakes. Spend 20 minutes pulling actual numbers for your top 20 SKUs and your profit reports become genuinely useful.
A note on security: connect third-party tools via OAuth only. Never paste your eBay credentials into a tool that asks for your username and password directly. OAuth grants scoped access that you can revoke at any time from your eBay account settings.
What actually works in live stores
Most sellers spend their first month staring at impressions and wondering why nothing’s moving. Here’s the honest version: impressions tell you whether eBay is showing your listing. CTR tells you whether buyers want to click. Conversion rate tells you whether the listing closes the deal. Those three metrics, in that order, are the only diagnostic chain you need to start.
Price matters, but it’s rarely the first lever. A listing with a bad main image will underperform at any price. Fix the image, then test the price. Images before pricing, every time.

Inventory sync is the one thing sellers underestimate until they get their first oversell. One oversell during a busy promo can cost you a defect, a negative review, and a buyer who never comes back. A 1–2 unit buffer costs you almost nothing in lost sales and saves you from that outcome. Set it before you need it.
Realistic timeline: most sellers see measurable CTR improvement within 14 days of fixing their lowest-performing listings. Sell-through improvement takes 30–45 days because you need enough transactions to see a pattern. Margin improvement takes the full 60 days because it requires both better pricing and lower-cost sourcing decisions working together.
One pitfall worth naming: don’t optimize for revenue when you should be optimizing for margin. A seller who doubles revenue but keeps thin margins has just doubled their workload for the same profit. Track net margin per unit from day one, not as an afterthought.
(And yes, the dad joke is coming: Why did the eBay seller bring a spreadsheet to the family dinner? Because he heard there’d be a lot of “sell-through” on the turkey.)
SpareDollar turns your analytics into live listings, not just reports
Most analytics tools stop at the insight. SpareDollar connects the insight to the action. You see a winning SKU in your Top Winners dashboard, and the next step is a bulk-listed, AI-drafted version of that listing pushed to every channel you sell on, with per-channel pricing and auto-delist already configured.
The free trial includes: import from eBay, 7-day full sync, basic profit analytics, and 5 AI-assisted listing drafts. Setup takes under 30 minutes. Connect via OAuth, import your orders, map COGS for your top SKUs, and your first profit report is ready the same day.
U.S. sellers connect through eBay’s official OAuth flow. No stored passwords, no third-party credential handling. Your data stays yours.
See what SpareDollar covers across every marketplace and start your free trial today.
Sources
These are the primary sources used in this article, each covering a distinct part of the eBay analytics and inventory workflow.
- eBay Seller Hub
- eBay Market Insights: Price Trends, Products & Sellers
- How to Use eBay Orders Item Performance Analysis in eBay (tutorial)
- eBay Inventory Management: Multi-Channel Seller’s Operations Guide (2026)
FAQ
What is an eBay analytics dashboard?
An eBay analytics dashboard is a reporting interface that aggregates sales, listing performance, and inventory data to help sellers identify trends and make pricing or listing decisions. eBay Seller Hub is the native version; third-party tools add profit reporting, cross-channel sync, and automation.
How do I export data from eBay Seller Hub?
Go to Orders → Export in Seller Hub and select a date range to download a CSV with transaction-level data including sold price, fees, and shipping. For listing performance, use Research → Listing Analytics and export or screenshot by date range.
When should I upgrade from Seller Hub to a third-party dashboard?
Upgrade when you’re selling on more than one marketplace, when you need per-unit profit visibility after fees and COGS, or when manual CSV exports are consuming more than an hour per week. Those are the three clearest signals that a paid tool pays for itself.
What metrics should I check first on any eBay dashboard?
Start with CTR, sell-through rate, and net margin per unit.
Does SpareDollar work as an eBay analytics dashboard?
SpareDollar includes profit analytics (COGS plus fees plus shipping) and a Top Winners dashboard alongside its cross-channel listing and inventory sync features. It’s designed for sellers who want analytics connected directly to listing actions, not a standalone reporting tool.